Bearing Problems – Fault Frequency and Artificial Intelligence-Based Methods
The fault diagnosis of rotating machines plays an important role to reduce the catastrophic failures and production lost tonnage. Associated with rolling-element bearings are one of the key elements to follow. The early detection and fault analysis of bearing problems is crucial.
When a rolling-element bearing develops flaws on the races and/or rolling elements, there are four vibration frequencies that can result:
- outer race (BPFO),
- inner race (BPFI),
- rolling element (BSF), and
- cage (FTF).
Moreover, bearings generally go through four stages of vibration characteristics as the defect progresses.

Thus, identifying these characteristics can not only help to verify that a bearing is definitely failing, but can also give some indication of the extent of the deterioration of the bearing.
Stage One
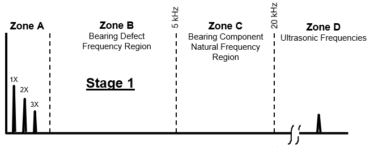
The earliest indications of bearing problems appear in ultrasonic frequencies ranging from approximately 20 kHz.
To detect that first symptom, ultrasound or the high-frequency vibration techniques like Spike Energy, Shock Pulse or PeakVue are required. What’s important is all those methods can be very effective at detecting many of the fault conditions.
At this early stage of deterioration, microscopic cracks appear creating elastic waves.
The energy content of these elastic waves is still very low in this stage being several magnitudes weaker than the low frequency, however measurable. To ensure the increase in Enveloped Acceleration spectrum is visible and frequency response great enough the type of sensor, sensitivity (10 mV/g, 100 mV/g, 500 mV/g, etc), mounting techniques (magnet, adhesive or stud mount) or proper settings matter most. Moreover the sensor to be mounted as close to the load zone of a bearing as possible, if applicable (access). Very effective can be also shock pulse transducer or combination of standard accelerometer and shock pulse transducer, especially for bearings of low speed equipment.
The remaining life at this stage is more than 10% to 20% of L10 life of bearing.
Stage Two
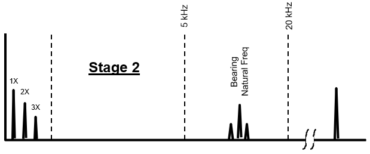
At stage two, the bearing deterioration progresses. As a result, the high-frequency detection method will continue to increase. In addition, at stage two, the intensity of the impact forces has increased sufficiently to excite the natural frequencies of the various bearing components. The bearing natural frequencies depend on the dimensions of the bearings and how these are mounted. Typically, the natural frequencies can be found in the 2-6 kHz range.
At the end of stage two, sidebands appear above and below natural frequencies and high-frequency detection method continues to increase.
Once a stage two level of deterioration is confirmed, the machine should be monitored carefully and even more frequently if required in order to judge the rate of deterioration.
The remaining life at this stage is less than 5% to 10% of L10 life of bearing.
Stage Three
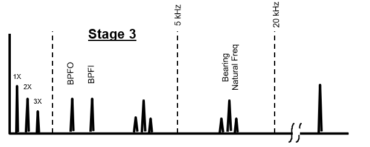
At stage three, the bearing deterioration progresses and readings continue to increase. In addition, characteristic of stage three will be the appearance of specific bearing defect frequencies in the spectrum.
Once a stage three level of deterioration is confirmed, the machine should be planned to shut down and the bearing replaced at the earliest opportunity. If the machine cannot be shut down the frequency of checks should be increased accordingly, depending on the type of equipment, load and the speed, even once per week, once per day or once every few hours.
The remaining life at this stage is less than 1% to 5% of L10 life of bearing.
Stage Four
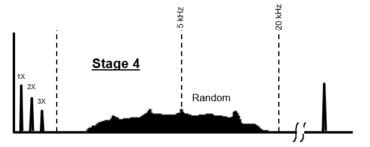
Stage four is the final stage of bearing deterioration before total failure. If the bearing reaches stage four, the high-frequency detection method levels may actually decline. The edges of the raceway or rolling element defects begin to round off, which actually reduces the intensity of the impact forces. Metal which has been removed from the various bearing components may actually fill in some of the more severe flaws and be smoothed over by rolling elements. However, during this process, the clearances within the bearing are beginning to increase substantially, creating a significant looseness condition. The result will be a noticeable increase in overall vibration velocity amplitudes. Not less importantly, the discrete bearing defect frequencies disappear and are replaced by random vibration in the form of a noise floor.
At stage four, total catastrophic failure of the machine can occur at any time.
Knowing now all the stages and bearing condition in each in of them, from a practical point of view the high focus at stage two and three should be on analyzing these correctly to help detect problems in advance and avoid potential failure.
Moreover as mentioned already, characteristic of stage three will be the appearance of specific bearing defect frequencies in the spectrum. These are the four frequencies that were mentioned earlier (BPFO, BPFI, BSF and FTF).
Since bearing defects generate vibration in the form of impacts, the fundamental bearing defect frequencies will often be accompanied by multiple harmonically related frequencies as well. Generally speaking, the more harmonic frequencies there are, the worse the bearing condition.
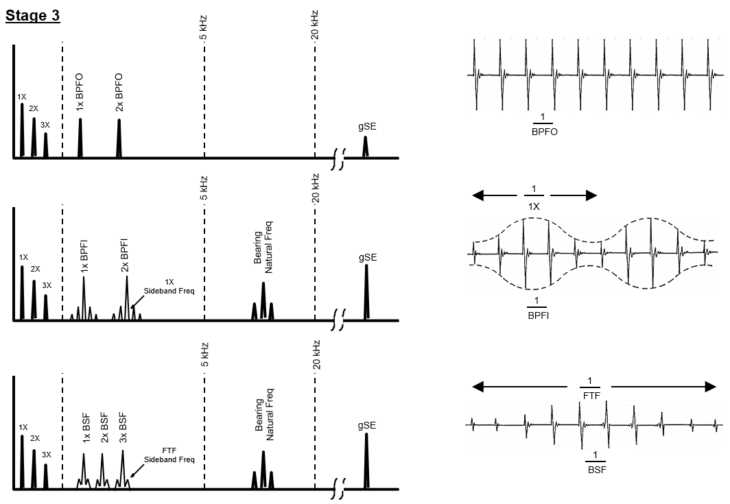
The inner raceway defects will generate frequencies different from outer raceway defects. In addition, inner raceway bearing defects will normally be accompanied by sideband frequencies spaced above and below the bearing defect frequencies. These sidebands will be spaced at ± 1x rpm of the machine. Like the resonant frequencies, the amplitudes of the specific defect frequencies are rarely very high. Similar to inner race, rolling element bearing defects will be accompanied by sideband frequencies spaced above and below the bearing defect frequencies, but in contrast to inner race here the sidebands will be spaced at ± FTF.
To verify our theory, let’s look now at a practical case study:
- water pump motor
- running speed – 1485 rpm
- motor DE and NDE bearing – FAG 6319
Manufacturer data based FAG 6319 orders are:
- FTF 0,3984
- BSF 2,358
- BPFO 3,585
- BPFI 5,415
Converted orders (cpm), taking into account the motor speed are:
- FTF 591,624
- BSF 3501,63
- BPFO 5323,725
- BPFI 8041, 275
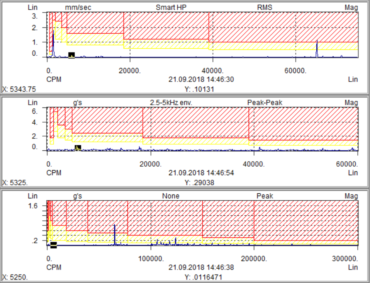
Bearing fault frequencies at stage two:
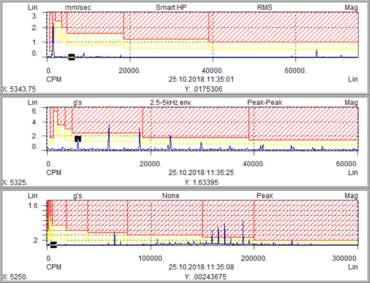
Bearing fault frequencies (clear BPFO) at stage three:
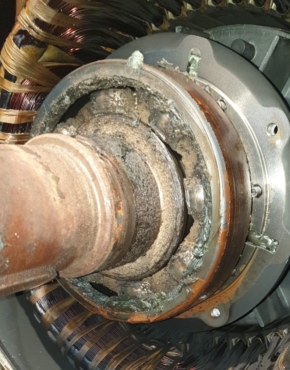
Bearing condition after machine stoppage:
As already shown, most defects in rotary equipment, bearings included, are accompanied by impact processes with certain resonant frequencies. The vibration signal of the equipment can contain from one to several expressed resonant frequencies, depending on the degree of defect and their number.
The most popular method for generating the domain of informative features, where a team of experts in vibration-based diagnostics carry out the condition monitoring, is the method of analyzing the spectral components. However, importantly, the vibration monitoring techniques that are widely used at present generate the domain of informative features of equipment defects in a form that is extremely problematic for automatic systems. The main issue is that the scope of this description is not sufficient at all for steady work of machine learning algorithms. Nevertheless, during more than half a century many guides have been written, classifiers (vibration-based condition monitoring maps) have been developed and prescribed for a lot of various equipment types, etc. The analysis methods based on this experience should be definitely applied to a good automatic system. Moreover, all informative features calculated by the vibration signal spectrum and envelope spectrum should be involved in forming a vector of informative features of equipment technical condition, which is to be used by the classifier based on deep learning and fuzzy logic.
Not less important both for the human expert and the automatic system should be the time waveform analysis. While the human expert can analyze the patterns (see stage three fault frequencies), at the end mostly the focus will be on spectra. For the automatic system as a part of deep analytics while analyzing time waveform, the focus should be on the wavelet functions and energy contribution. It should be noted that from the wavelet decomposition point of view the vibration signal is most effectively represented not in the form of a superposition of a large number of signal components, but only with a few that have the largest energy contribution.
Artificial intelligence is to be used also for the automatic analysis of the kinematic scheme using the sets of informative features of equipment components defects. Defined this way, the sets of informative features are to be further used for training classifiers and searching for corresponding defects by vibration signal processing.
The human expert also has to know the kinematic scheme, which equipment components are involved in the transfer of motion (gears, bearings, shafts, screws, shafts, pulleys, couplings, etc.), which take the main dynamic load, etc..
Last, but not least, parts of the automatic system requirements are methods for estimating the equipment’s remaining useful life.
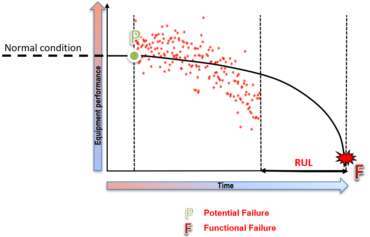
Very often, the question “How long will the bearings last?” is asked of the vibration human expert. Although it is impossible to answer this question, using statistical methods it is possible to estimate a part of bearing life by calculating so called remaining useful life (RUL).
The easiest way to explain how the job is done by a human expert is to show it graphically on a P-F curve. The key job here is to move the block of data along the time to find the most probable position with regard to the curve of degradation pattern and then estimate remaining useful life.
The automatic system will take very similar approach.
Of course the method used to calculate RUL depends on what kind of data we have. Here the example can be:
- lifetime data which show how much time it took for similar machines before the failure occurred,
- run-to-failure (RTF) data of machines similar to the one diagnosed, or
- known limit (threshold) value of a condition indicator that detects failure.
Both the human expert and automatic system with lifetime data should use proportional hazard models and probability distributions of component failure times. Then for RTF data similarity methods are recommended. Last, but not least, having threshold data degradation models to be used. So finally it is all about the statistics and proper historical data management. Nevertheless it must be remembered that this is only an estimation of bearing life. This does not take into account other factors such as inadequate/incorrect lubrication, lubricant contamination or damage caused by improper storage or installation, all of which will have an adverse effect on the life of bearings.
In summary, if the bearings are properly installed, any residual unbalance is removed and the machine is properly aligned then there will be fewer forces generated in the bearings and then it is possible to extend the operating life before fatigue sets into the bearings and before we again detect the first bearing problems faults frequencies, does not matter analyzed by human expert or automatic system.


Good job Pawel! I’m glad that you mentioned also the value of lubrication – without good quality of lubricant and it’s condition the reliability will be still not efective as should be.
Nice article Lecinski!
How could you get these fault frequencies from FAG 6319? I’m a newcomer to machinery analysis and I did not found these infos in their catalogue, nor ball sizes/numbers to calculate the frequencies.
Hi Lucas, normally you should get these fault frequencies from your vibration software where bearing frequenciess add is a part. Sometimes these info could be found in some manufacturer catalogues, but it is not the rule. If bearing analysis software is not available for you or you could not find any catalogue info, bearing defect frequencies could be mathematically calculated. BPFO = (Nb/2)[1–(Bd/Pd)cosø] BPFI = (Nb/2)[1+(Bd/Pd)cosø] BSF = (Pd/2Bd)[1–(Bd/Pd)^2 cosø^2] FTF = (1/2)[1–(Bd/Pd)cosø] where: Nb = number of balls Bd = ball diameter Pd = pitch diameter ø = contact angle If you are already a newcomer I do not… Read more »
Hey Pawel,
Do you know is this formulas BPFO, BPFI, BSF, FTF apply for single tapered roller bearings? – Ball diameter parameter in particular will be challenging as the rollers are tapered – otherwise, how would you adapt this formulas for that type of bearings? (Bd = (Roller max diameter – roller min diameter)/ 2 ? )
Thanks for your great article! Is it probable to see the bearing characteristic frequencies in the spectrum when the machine is working in its normal condition (without any fault)?
Great article Pawel ! Specially the staging explanation for the procedure of fault finding. I am currently working for modeling the bearing faults and your article has nicely explained it. Sometimes we dont get full specifications of the bearings in plants and then starts the real challenge to reverse engineer the specs from fft. Keep up the good work.