To stay competitive in today’s marketplace, all asset-intensive organizations are facing the same sorts of challenges from demanding stakeholders – a relentless focus on safety, efficiency, and environmental footprint, all within tight budgets.
Asset managers across industries are all feeling the intensifying pressure to consistently prioritize resources correctly and make effective decisions accordingly.
When it comes to decision-making, humans skew towards playing it safe, continuing to make the same choices again and again because they feel comfortable – “This is the way we’ve always done it.” Sound familiar? But this subjective way of making decisions can lead to ineffective decisions unaligned with your company’s bigger-picture strategic goals.
Effective decision-making requires a quantitative approach that is justifiable, consistent, and above all, aligned with the greater strategic business goals.
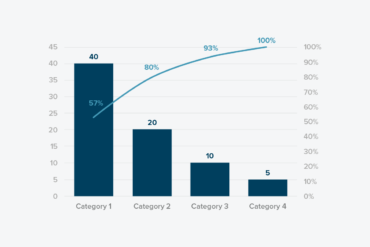
Pareto Analysis: A tool for targeting
The first and most important step toward effective decision-making is defining the problem[s] – the assets or systems having the greatest negative effect on your organization.
One method for identifying the biggest asset-management issues is Pareto Analysis. Pareto Analysis is a simple technique for prioritizing possible changes according to how much they will improve the situation. This method uses the Pareto Principle – also known as the 80/20 rule – which states that in most situations, 80% of effects are generated by 20% of the causes. Pareto Analysis is a simple but effective decision-making tool; it doesn’t provide solutions to the situation, but it does help the asset manager target the few significant issues causing the majority of the problems.
To use Pareto Analysis successfully, you must understand what your business drivers are – what are the organization and its stakeholders trying to achieve? Is it higher production, lower operating expenses, or both? This knowledge helps determine which problems you analyze for, then you can rank the problems according to their level of negative impact on the company.
In this context, the troublesome causes will likely be systems, assets, or even specific failure modes, if you get that detailed. This information will help guide the asset manager on what they should focus on first.
Of course, there may be multiple causes. When such is the case, determining exactly where the opportunity for improvement lies can be difficult – requiring a more complex tool.
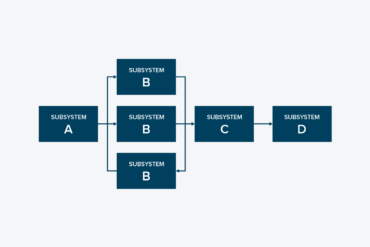
RBD Modelling: Next-level prioritization
Reliability Block Diagram (RBD) modeling can be used to pinpoint key performance detractors, determine improvements, and quantify their subsequent impact on the business. It incorporates plant configuration, modeling equipment redundancy, buffers, and workarounds to calculate the contribution of a particular asset to overall plant performance.
The RBD model highlights systemic bottlenecks and ranks performance detractors, enabling if-then scenario planning – if “A” change is made to “B” asset, then “C” improvement will result. This tool lets asset managers compare “apples to apples,” helping ensure their decisions are quantifiable, justifiable, and consistent.
As with Pareto Analysis, you need to incorporate the organization’s strategic goals into the RBD model. Not only can the impact of equipment failure be predicted using detailed characteristics and maintenance data, but risk profiles can be generated to indicate which assets or systems are preventing the company from achieving its goals. RBD modeling helps asset managers identify issues as well as perform a cost-benefit analysis on any proposed solutions, making it an incredibly powerful decision-making tool.
Combining methods for cost-effectiveness
As you might expect, developing a plantwide RBD model is both time and resource consuming, and so is often overlooked as an effective decision-making method. One way to make RBD modeling more feasible for your organization is to perform Pareto Analysis first. It might highlight a specific area or system significantly affecting the company; then the RBD model can be tailored to suit, substantially reducing the time and resources necessary for development.
While both Pareto Analysis and RBD modeling are quantitative methods, they don’t require years of historical work order/production type data to be effective; the experience of the site and its resources can be leveraged to create representative data. And, as more data becomes readily available, your decision-making process will become more refined, more consistent, more transparent, and – above all – more effective.
For more information please visit www.armsreliability.com.