Machine data is the set of physical quantities and attributes that the machine has or creates. This data is provided by various sensors, software, and machine manufacturers. Recently, machine data has started to attract more attention as the use of IoT and big data management technologies has increased. Machine data sometimes called machine-generated data; is digital information automatically generated by the activities and operations of networked devices, including computers, embedded systems, and connected sensors. In a broader context, machine data may also contain information generated by suppliers, end-user applications, manufacturers, etc.
We can basically divide data types into two:
– Quantitative data
– Qualitative data
QUANTITATIVE DATA
Quantitative data are numbers or the value of data in countable form, where each dataset has a unique numerical value. This data is any measurable information that researchers can use to make real-life decisions based on these mathematical derivatives for mathematical
calculations and statistical analysis. Quantitative data makes the measurement of various parameters controllable due to the ease of mathematical derivatives they come with.
In predictive maintenance applications, evaluations and plans are usually made based on the quantitative data obtained from the sensors. The data collected from these sensors can also vary within itself. The sensors convert the analog signal into a processable digital data and while applying this conversion, it is subject to various rules according to the data to be collected. If the data to be collected is only time-based data such as position, pressure or flow, overall value measurement are usually made. If the data to be collected is also desired to examine frequency-dependent changes, it should be sampled at least 2 times the maximum frequency desired to be monitored.
Vibration, which is one of the most important data used in the condition analysis of rotating machines, can be collected in 2 different types. Vibration sensors used in PLC-SCADA systems are generally overall value vibration sensors. These sensors use certain features such as RMS, Crest, Kurtosis, which it extracts from the vibration signal collected with fixed sampling frequencies at a certain time. These features are actually another data extracted from the measured data. On the other hand, the sampled signals can be analyzed in time-wave form at certain interfaces and the processed signals in different spaces such as spectrum and cepstrum.
Different statistical data can be obtained from a collected signal data, as well as data which is also called “data about data” calculated from 2 different data. These data can be the extraction of power data from current and voltage values, as well as the phase difference from two different vibration data or the stiffness/damping properties of the structure from force and vibration data. At the same time, coherence, correlation and covariance data, which includes statistical comparison results of 2 different data, can also be examined under quantitative data.
The collected signal data is also divided into different groups within itself. Most machine components give rise to certain vibration signals that characterize their separation from others, as well as distinguishing the faulty state from the healthy state. Distinctive features may be different repetition frequencies. For example; there may be a gear network frequency characterizing a particular gear pair, and different sideband gaps characterizing the modulating effects of two meshing gears on their common network frequencies. Vibration signals collected for predictive maintenance can be categorized in several ways. The type of signal obtained also affects the signal processing technique that should be applied. We can categorize vibration signals as in the image below.
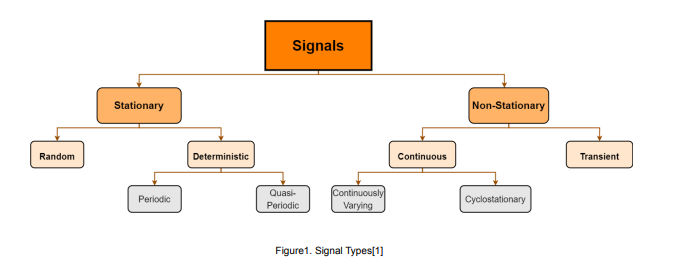
The most basic distinction in signals is stationary and non-stationary. Stationarity means that statistical properties are time-invariant. Deterministic signals basically mean that they are composed entirely of discrete frequencies of self-forming sinusoids. Knowing the frequency, amplitude and initial phase (ie at time zero) of these components, the value of the signal can be estimated at any time in the future or in the past; hence it is “deterministic”. Random signals are somewhat more complex as their values cannot be predicted at any time, but for stationary random signals their statistical properties do not change over time. “Non-stationary” means anything that does not satisfy the stationary conditions and can be divided into two main classes, “continuously changing” and “temporary”. There is no hard rule to distinguish these two types, but in general it can be said that transient signals only exist for a limited period of time and are typically analyzed as presence only during that time. To explain this; for example, a decreasing exponential function theoretically decreases to infinity, but in practical terms it has measurable value only for a finite time.
By definition, a stationary random signal has a constant power and thus infinite energy. Cylostationary signals, by definition, have power that varies periodically over time, and hence their total energy is infinite. Other non-stationary signals, such as vibration signals measured during operation or deceleration of a machine, also have a finite length, but are typically more likely to be considered as constantly changing non-stationary signals rather than transient events. Continuously changing non-stationary signals are usually analyzed by time/frequency analysis techniques.
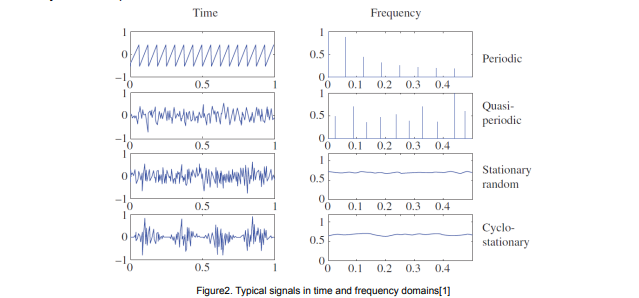
According to Figure 2, the first two signals (periodic and semi-periodic) are deterministic and consist of completely separate sinusoidal components. For the periodic (saw-tooth) signal, these components are in integer multiples/harmonics of the fundamental periodic frequency. For a semi-periodic signal, the individual frequencies are not all multiples of a harmonic series. This means that in semi-periodic signals, the frequency ratio between at least two components must be an irrational number. A typical example is given by vibration signals from a gas turbine engine with several independent shafts. Each shaft will normally generate harmonic families, but the total signal will be semi-periodic. The third signal (stationary random) does not look very different from the quasi-periodic signal in the time domain, but its spectrum is completely different, there are no discrete frequencies, and its spectral power is constantly distributed with frequency. The example shown is ‘white noise’, which has a uniform spectrum in the frequency range considered.
The cyclo-stationary signal is an amplitude modulated white noise. Signals in which amplitude modulation of a signal (with a single frequency) results in pairs of sidebands in the spectrum spaced around each frequency component modulated by an amount equal to the
modulation frequency.
A typical cyclically non-stationary signal is not shown in Figure 2, but may be similar to the cyclo-stationary signal there, except for example, that the period of the modulating signal is not constant but changes deterministically with time.
QUALITATIVE DATA
Another important category of machine data is qualitative (Meta) data. Metadata is data added to an event to describe the conditions under which the event occurred. For example, every time you take a photo with your phone’s camera, metadata about the photo is automatically generated, including the date the photo was taken, the aperture of the camera lens, the exposure time, the GPS location, and more. Similarly, vibration, temperature, speed, etc. collected in predictive maintenance in addition to information such as the collected bearing model, the connection of the pedestal to the ground, the information that characterizes the system, such as the coupling type, are analyzed by correlating them with quantitative data in fault root-cause diagnosis and maintenance planning.

Machine-generated data is raw and factual, often providing a simple record of the value of an event or a particular parameter at a particular time. Machine health softwares, predictive maintenance platforms, are used to monitor data at another time and correlate it with additional machine-generated data and data from other sources. Adding context to data answers questions such as:
“Where did this data come from?”
“What do these data represent?”
“When was this data collected?
Answering these questions contextualizes data and turns it into knowledge. At the knowledge level, we begin to analyze, understand and develop insights into the relationships that exist in the data and what it tells us about the overall state of the system. Whether we look at data from a service or security perspective, the goal is to use the data to make a concrete determination or prediction about something.
Machine Data Analytics tools follow the basic DIKW pyramid for processing machine data. First, data is collected from various sources in the network. Next, an AI application uses algorithms to sift through data, identify trends and monitor changes. The information is then extensively analyzed and correlated system-wide to generate new knowledge and insights. Finally, when insights are reported to users, someone can take action on the insights to improve the state of the system.
REFERENCES
[1] Randall, R. B. (2022). Vibration-based condition monitoring: Industrial, automotive and
Aerospace Applications. Wiley.