To understand the importance and the benefits of a Reliability and Precision Program, it is of the upmost importance to have an understanding of failures firs first. The other two articles will cover how create value and sustainability by extending the left side of the P-F curve and how all this relates to safety and the P-F curve. Because of the length of these three topics, they will be presented separately in three articles.
Over the years many studies relating to equipment failure patterns have been performed. United Airlines, the US Navy, Bromberg and RCM by Nolan and Heap conducted some of the most popular that have been published. The goal of these studies were to determine if failures demonstrated some types of patterns, understand the inputs to the failure patterns and determine what can be done to prevent and/or extend the mean time between failures. The studies indicated that there were failure patterns. When comparing all the failure patterns, the failure information is rather surprising. The majority of failures have nothing to do with time, age or wear; they are random.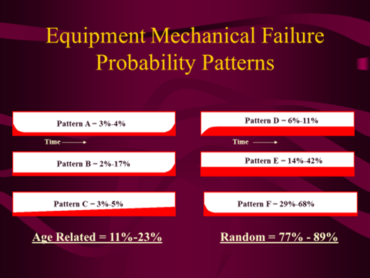
Age related failures equal 11% to 23% of all failures.
- Failure Pattern A is known as the bathtub curve and has a high probability of failure when the equipment is new (infant mortality), then a long period of low probability random failures over time and then sharply increasing at the wear-out point. This pattern accounts for 3% to 4% of failures.
- Failure Pattern B is known as the wear out curve beginning with low level random failures that remain the same and sharply increases at the wear out point. This pattern accounts for 2% to 17% of failures.
- Failure Pattern C is known as the fatigue curve where the failure levels increase over the age of the equipment with no identifiable wear out point. This pattern accounts for 3% to 5% of failures.
Random failures equal 77% to 89% of all failures.
- Failure Pattern D is known as the break-in curve that starts out with a low probability of failure (new equipment), then sharply increases to a constant level of random failure probability. This pattern accounts for 6% to 11% of failures.
- Failure Pattern E is known as the random pattern (no curve) has a constant level of random failures over the life of the equipment. This pattern accounts for 14% to 42% of failures.
- Failure Pattern F is known as the infant mortality curve where the probability of failure is high when the equipment is new, followed by very low level probability of random failures and slightly increasing over the age of the equipment. This pattern accounts for 29% to 68% of failures.
The failure information is surprising when comparing all the failure patterns. The majority of failures have nothing to do with time, age or wear; they are random. So the myth of “time based/proactive maintenance will provide reliability” is busted. In reality, time based/proactive maintenance can greatly increase the probability of an infant mortality failure.
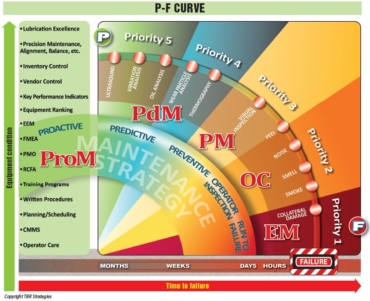
Patterns D, E and F indicate that the failures are all random. Patterns D and E are random and the percentage of occurrence is high. There is value in addressing these two failures. The focus towards reducing and/or eliminating the impact of these failures is through condition based maintenance using condition monitoring or predictive maintenance technologies to determine when is the right time to conduct maintenance. “The right maintenance and the right time” or “Don’t fix it unless it’s failing to meet it’s intended function”. Pattern F, early random failure percentages are huge, providing great potential for added value and reliability for an organization. The focus to address pattern F failures are through Reliability and Precision Programs.
Critical to condition monitoring is understanding the Potential Failure (P-F) curve and its benefits. The PF curve is defined as the interval between the point in time when a potential failure becomes detectable and the point in time at which it degrades into a functional failure (the point of failing to meet an intended function).
There are many different condition monitoring technologies or predictive tools that are used to detect these potential failures. All the technologies have specific applications in which they work best but can also be used to support the findings of one of the other technologies. The technology selected and the frequency of the inspections are determined by the criticality of the asset, the failure being detected and the effectiveness of the technology.
Condition Monitoring/Predictive Maintenance Technologies
- Ultrasound Detection, P-F Interval 1-12 months
- Vibration Detection, P-F Interval 1-9 months
- Oil Analysis Detection, P-F Interval 1-6 months
- Performance Monitoring, P-F Interval 1-6 months
- Thermography Detection, P-F Interval 1-6 months
- Audible Noise Detection, P-F Interval 1-4 weeks
- Hot to Touch Detection, P-F Interval 1-5 days
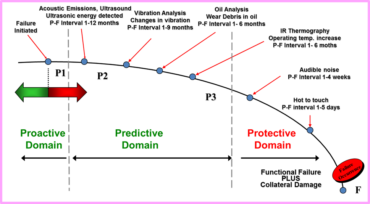
Having the knowledge of the condition monitoring technology used to detect the failure, the level of energy the problem is emitting and the P-F Curve Interval aids in applying the appropriate priority to the corrective repair work order.
Condition monitoring/predictive maintenance technologies are essential in the early detection of failures. Many individuals claim that condition monitoring/predictive maintenance is a proactive maintenance methodology because the potential failure is detected early enough to properly plan and schedule corrective action. Others claim it is a reactive maintenance methodology because the failure has already occurred, it takes time to detect the symptom of the failure after it occurs and the methodology does nothing to prevent it from happening again. No matter which side of the fence you are on, proactive or reactive, condition monitoring/predictive maintenance has proven its value in by preventing catastrophic asset failures and allowing the repair work to be planned and scheduled.
A couple of questions I’d like you to contemplate before my second article relating to extending the left side of the P-F curve, reduce costs, create reliability and value. Is your condition monitoring/predictive maintenance program helping your organization do anything to extend the mean time between failures of your assets or is it helping you perform better planning scheduling of work and preventing catastrophic failures? I am not say not saying better planning scheduling of work and preventing catastrophic failures is bad. With the challenges facing most organizations we need to be concerned about creating value and sustainability. How would you use or how are you using your condition monitoring/predictive maintenance program to extend the left side of the P-F curve, reduce costs, create reliability and add value?
Please note this article reflects the views, thoughts and opinions of the author only. The author has been working the fields of condition monitoring, precision maintenance and reliability since 1983. Thank you and if you any questions or feedback please add a comment and Tod Bear will respond back to you.


Great summery and explanation, but let’s have full resource and its quote