Two Minute Tips  

Vibration Tracking – The Looking Glass Technique – See the Invisible

Dr. Thierry Erbessd | President and Chief Innovation Officer, Erbessd Instruments

Incredible as it may seem, the vibration (or at least a large part of it) can be detected through video recording with incredible resolution. Saving a huge number of hours in studies that before were time consuming if not impossible to do. All of this using Vibration Tracking.

So, what is the Vibration Tracking? And better yet, what is it for?

What is the Looking Glass Technique?

The Looking Glass Technique is the ERBESSD INSTRUMENTS method used to obtain Meaningful Vibration signals from a video recording combined with a unique and trusted calibration method that utilizes a traditional accelerometer signal. It is a vibration analysis method that uses our unique micro motion tracking algorithm in video files. In fact, it is used today to detect and measure vibrations of thousands of points simultaneously with only one video recording.

The results of this type of vibration analysis depend on the quality of the recording. Likewise, the maximum frequency visible in the spectra is related to the number of frames per second that have been taken.

How can the Looking Glass Technique help me?

Video Vibration Tracking allows users to measure thousands of points at the same time which, otherwise, would be either impossible to measure or they would consume a lot of time with conventional methods. In this way, it gives you the possibility to analyze structures, movement, deflection and phase much more precisely, and with very little effort. At the same time, this technique allows users to export amplified vibration simulations that are very easy to interpret even for people who are not experts in vibrational analysis.

How does the Looking Glass technique work?

The smallest movement that this method can detect is much smaller than the pixel size of a conventional camera. So how does it work?

The principle of this method is based on the fact that, in a conventional camera, before an object moves from one pixel to another, it creates a small color change in the next pixel. In fact, the color from both pixels change progressively until the object occupies entirely the next pixel sensor.

This method measures the change in the amount of color from each pixels (In fact from an entire area of pixels). First, the software identifies color patterns within small predefined areas. These patterns must have important color differences in order to distinguish it from the rest of the patterns. The target areas are found automatically by the software and the user can only modify some quality parameters and surface.

Second, for each video frame, the software will identify the average color changes on the targeted points and its corresponding area. Thus, being able to track small changes in each frame with great accuracy.

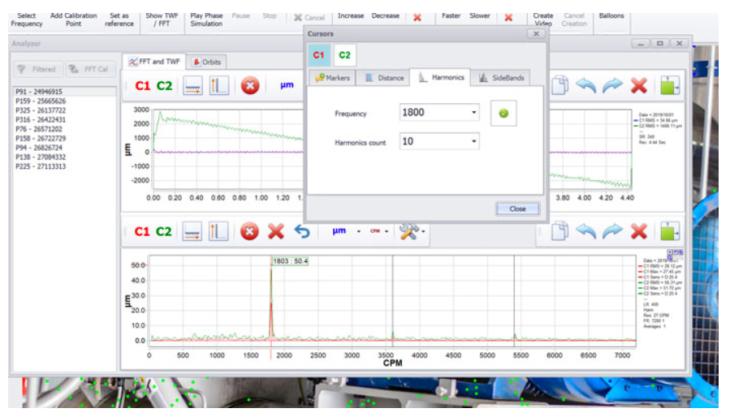
In the end, all that information obtained is translated into vibration signals that can be studied by its FFT, phase, or time wave form.

Reliability in Amplitude

To obtain reliable vibration tracking values, it is essential to have a calibration system. All cameras have different types of lenses, as well as resolutions, not to mention that the Zoom used and the distance at which the video is taken can change the appreciation of the movement.

Therefore, the system needs a comparative calibration to achieve reliability. The best method to calibrate these signals is using an accelerometer.

There are 2 comparative methods used to calibrate these type of signals:

By RMS value: this method requires a single point on the machine to be measured with a conventional vibrometer. The software will then calibrate the movement according to the RMS value of that point.

By Cross Channel: this method is the most accurate and requires a complete recording of the vibration signal for the software to process it in the form of a spectrum (FFT). Using this method the software will be able to calibrate each frequency individually eliminating false frequencies that could be generated by the Aliasing effect.

What failures can I diagnose with the Looking Glass Technique?

There are many failures that can be detected with this technique. Mainly those related to low frequencies and phase. For example:

  • Imbalance
  • Misalignment
  • Mechanical Looseness
  • Bent Shaft
  • Eccentricity
  • Resonance
  • Natural Frequencies (By shock test)
  • Electrical Noise

Differential Vibration Analysis

Differential vibration analysis is a study that analyzes the vibration of one area by subtracting the vibrations of another zone. An example is to measure the vibration of an electric motor by subtracting the vibration from its own base (which could be generated by a larger mass or by another motor). This method analyzes the vibration coming exclusively from this motor.

Differential vibration analysis is a very rare type of study due to the difficulty of doing it with current techniques. With the Looking Glass Technique, this is very easy because you only need to select a reference area so that these vibrations are automatically subtracted from the rest of the points.

Non-Invasive Vibration Analysis

There are many cases in which the mass of an accelerometer completely changes the behavior of the vibration. This is the case when attempting to gather meaningful data from items with small masses such as a cable, very small motor, radio control airplanes etc.

Looking Glass Technique completely eliminates this problem, since it does not use sensors, the analyzed object will vibrate naturally.

Large scale vibration analysis

Another major limitation of vibration analysis is large scale objects, such as Buildings, Bridges, Large Ships, Airplanes.

Limitations of the Vibration Analysis Looking Glass Technique

Looking Glass Technique is an excellent complement for vibration analyzers but not yet a replacement since it still has some limitations related to maximum frequency and amplitude resolution.

The Maximum Frequency is determined by the number of frames per second taken by the camera (Frame Rate). Thus, the maximum visible frequency will be half of the Frame Rate (and for a reliable amplitude it would be: Frame Rate / 2.56).

Amplitude Resolution will depend on the number of pixels of the camera, as well as the distance from the camera to the object and the zoom used. Obtaining better resolutions when getting closer to the object to be measured.

Aliasing: Another problem with this type of analysis is the impossibility of avoiding the Aliasing effect. Usually, common vibration analyzers eliminate this effect using analog filters incorporated within the data acquisition interface. However, in a video, this is simply not possible.

(To read the full article click here)

Subscribe
Notify of
guest

This site uses Akismet to reduce spam. Learn how your comment data is processed.

0 Comments
Inline Feedbacks
View all comments

About the Author

Dr. Thierry Erbessd President and Chief Innovation Officer, Erbessd Instruments

Thierry Erbessd, Mexican entrepreneur who has revolutionized the field of Vibration Analysis and Dynamic Balancing worldwide.

Dr. Erbessd is a graduate of the National Polytechnic Institute of Mexico and is also a passionate programmer, he is the creator of DigivibeMX software that competes among the best systems for vibration analysis. He is currently the President and Chief Innovation Officer of the Erbessd Instruments, a leading company in solutions for industrial maintenance.

READ FULL BIO