Cost avoidance? Sure, why not. However, it is a method that has been continuously used through a great many programs that have gone the way of a great many programs. Why? While the numbers can appear impressive to those in the physical asset management realm, which allows consultants and some managers to push their concepts, it has very little impact on the boardroom.
In order to have the impact that we are looking for in sustaining a program, we must tie it to items that are meaningful and measurable. Go into the boardroom and talk about OEE, simple payback, wrenchtime, etc. and you will most likely receive a blank stare, or worse, impossible demands. How do our standard KPI tie to corporate KPI, goals, mission, vision and other items that leadership consider important? How to they know that bearing was going to fail soon when the machine was running and then it was out of commission in order to prevent a failure? It must tie to the budget and either profit or some other goal put forward by the company.
When corporate management has a focus on safety, demonstrate how your programs links with safety. If leadership believes that they must demonstrate energy efficiency and being part of a green economy, focus on energy and greenhouse gas emission reduction. In all cases, the program must demonstrate a positive change in some value, such as reduction in cost per unit of production, or reduced carbon emissions per unit of production. These are real and measurable values that can be demonstrated to leadership and will also show up on their own dashboards.
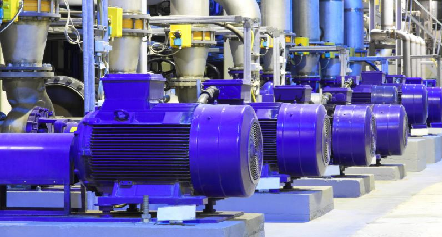
For example, we have six 150 hp electric motors paired with pumps operating at 105% load, or 157.5hp, average, or 157.5hp * 0.746kW/hp = 117.5kW. Vibration and electrical signature analysis discover that we have slight misalignment. With ESA, we are able to determine that the misalignment has an average value of 2.3kW for each. If the machines are running at an average of 6000 hours per year, energy is $10/kW demand and $0.06/kWh, then we are looking at a loss of:
Demand = (2.3kW * $10/kW * 12 months) * 6 machines = $1,656
Useage = (2.3kW * 0.06/kWh * 6,000) * 6 machines = $4,968
Total Energy Cost = $6,624
For greenhouse gas emissions: ((2.3 kW * 6000hr * 6 machines)/1000kWh/MWh) * 0.909 tons CO2/MWh = 75.3 Tons CO2/year and $6,624 in energy just from precision alignment. The reduction in load reduces thermal stress on the motor and friction stress on the bearings increasing the life of the machines signficantly. Separately, we can identify the cost avoidance of overhauling the electric motors, which are now operating closer to full load.
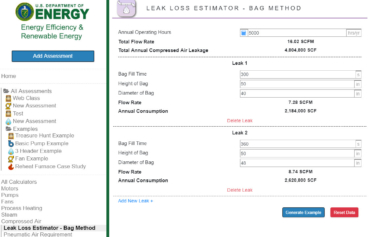
In the meantime, we discover two air leaks. Using the US Department of Energy’s MEASUR program (https://www.energy.gov/eere/amo/measur), we follow the ‘Leak Loss Estimator – Bag Method’ using a 55 gallon bag at 40”Wx50”H on a system that has a flow rate of 16.02 SCFM at 6000 hours (Figure 1) with a 300 second fill time on the first bag and 360 second fill time on the second. Total losses are 4,804,800 SCF at $0.02/SCF would be $96,096/year in leak losses. At 100 PSI and 4CFM/hp, the estimated electrical energy feeding the leaks through a good screw compressor would be (4,804,800 SCF/360,000 min/yr – we are going to equate SCFM to CFM for simplicity) 13.3 CFM. Then we look at the loss in kWh as 13.3CFM * 0.25hp/CFM * 60M/hr *0.746 kW/hp = 149kW/hr *6000 hrs = 894,000kWh/yr, which would be a combined electrical usage and demand rate of $0.107/kWh. The carbon emission reduction would be 894MWh at 0.909 Tons CO2/MWh = 813 Tons CO2 per year. The removal of the leaks would then improve the efficiency of the compressed air system and reduce pressure drops, in addition to the reduction of load on the system.
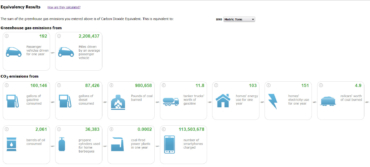
Improvements in both of the scenarios above is immediately measurable and will often bear additional savings through parasitic losses that occur. In just two leaks and six poor alignments we would show an impact of ~890 Tons CO2 and $102,720/year, which would cover the cost of technology and labor to find and correct these issues. If the company was building 100,000 widgets per year at a cost of $50/widget, this would represent a reduction of $1.03/widget, or 2.1% and a greenhouse gas emission reduction of 17.8 lbs CO2/widget, or the equivalent of one gallon of gasoline emissions, which would be the equivalent of 192 passenger vehicles driven for one year (Figure 2: https://www.epa.gov/energy/greenhouse-gas-equivalencies-calculator) for the widgets manufactured.
These are examples of ways that can be definitively demonstrated to leadership that they can also find in their budgets and goals. There are additional improvements that go along with these that can be measured including reduced waste stream, improved production, reduced overheads, and additional hidden costs. The key is bringing them forward so that the causes of these improvements can be recognized. In the end, maintenance will end up being identified as a method of controlling costs versus a cost of doing business. There will no longer be a need to come up with the 30 second elevator pitch as the improvements will be recognized.
The tools to assist us in bringing this information forward is provided through the US DOE, US EIA and the US EPA, which provides neutral information and tools. From experience, the results are primarily conservative due to other parasitic losses, which provides a level of confidence. The ability to use tools that are available will also provide support and real data that can be presented. Then tying the findings in with the corporate or division level data, or facility, will bring it all together.
Another important aspect that has been discovered through both experience and the Bureau of Labor Statistics is that there is rarely a headcount reduction when these programs are implemented in this fashion. Quite the opposite. In the programs that we have been involved with there is often an improvement in resources in order to find additional opportunities.