At the end of the last article, I asked a couple of questions for you to contemplate before my second article relating to extending the left side of the P-F curve, reduce costs, create reliability and value. Have you thought about your condition monitoring/predictive maintenance program and how is it helping your organization to extend the mean time between failures of your assets or is it helping you perform better planning scheduling of work and preventing catastrophic failures? I am not saying better planning scheduling of work and preventing catastrophic failures is bad. With the challenges facing most organizations, we also need to be concerned about creating value and sustainability. How would you use or how are you using your condition monitoring/predictive maintenance program to extend the left side of the P-F curve, reduce costs, create reliability, and add value?
A quick review of failure patterns and the potential failure curve before moving on will set the scene for the next topic of discussion. Keep in mind that there are six failure patterns that are related to equipment failures. These failure patterns were developed and tested across different industries and it has been determined that failures caused by the age of equipment are responsible for only 11 percent to 23 percent of all failures, and failures caused by nonage-related (or random) factors represent 77 percent to 89 percent of all failures.
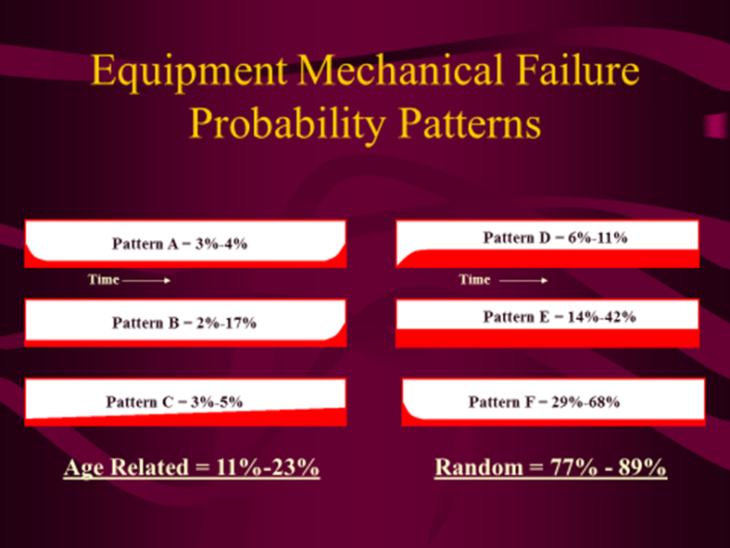
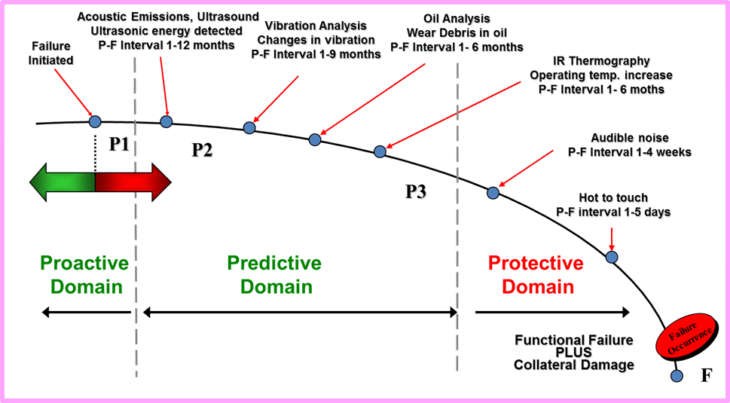
To learn that the majority of equipment does not wear out from old age is quite a revelation for most organizations. Understanding this fact created an industry focus toward reducing and/or eliminating the impact of the Pattern D and E failures through condition-based maintenance – using condition monitoring or predictive maintenance (PdM) technologies to identify potential failures early and determining the right time to conduct maintenance. Condition monitoring not only has helped in reducing the impact of patterns D and E but also provided insight into the root causes of all the other failure patterns. Predictive maintenance technologies are great tools to identify potential problems early (capable of detecting failure warning signs far in advance) as indicated in the predictive domain of the PF curve (shown below):
- Ultrasound Detection, P-F Interval 1-12 months
- Vibration Detection, P-F Interval 1-9 months
- Oil Analysis Detection, P-F Interval 1-6 months
- Performance Monitoring, P-F Interval 1-6 months
- Thermography Detection, P-F Interval 1-6 months
- Audible Noise Detection, P-F Interval 1-4 weeks
- Hot to Touch Detection, P-F Interval 1-5 days
The organization that evaluates the data generated by the PdM technologies and uses it to reduce or eliminate repeat failures will find it can extend run time between failures and/or develop proper time-based repair activities. Using this continuous improvement approach, root cause analysis and timing of the failures on Failure Pattern A (tail end), Pattern B, and Pattern C (age-related failures); the machines could be placed on a preventative maintenance repair schedule allowing for the maximum use of the asset’s components. Other times, a redesign might be economically justified to extend the life of an asset; an example would be the current MOC to test upgraded hammers in the coal crushers and fuel conditioners.
All these improvements will create value for an organization, but there still exists the potential to capture even more value. Consider the possibilities if the same continuous improvement and loss elimination approaches were used on Failure Patterns A and F to eliminate or reduce the infant mortality curve, and on Patterns D and E to eliminate or reduce the random failures? If accomplished, an organization would only have to monitor for Failure Patterns B and C and the infrequent random failure. The increased reliability and the value it creates would be huge – truly helping organizations attain a competitive advantage.

Two programs capable of providing these benefits and extending the proactive domain timeline on the P-F curve are found in reliability and precision programs. The old saying, don’t throw the baby out with the bathwater is very applicable here. Do not stop performing condition monitoring or preventive maintenance activities, they are necessary to your success! Keep in mind extending the use of your condition monitoring as quality control tools to make sure you receive the quality assets and precision installations that are specified. Not all-inclusive but at a minimum a reliability and precision program should include the following:
- Life Cycle Asset Management Plan
- Design for Precision/Reliability
- Procure Quality
- Precision Assembly, Alignment, and Balancing
- Precision Installation
- Precision Commissioning
- Work Processes, Procedures, and Standards
- Asset Condition Management
- Lubrication Reliability
- Clean and Inspect (5S)
- Operate for Reliability
- Loss Elimination/Continuous Improvement (Root Cause Failure Analysis)
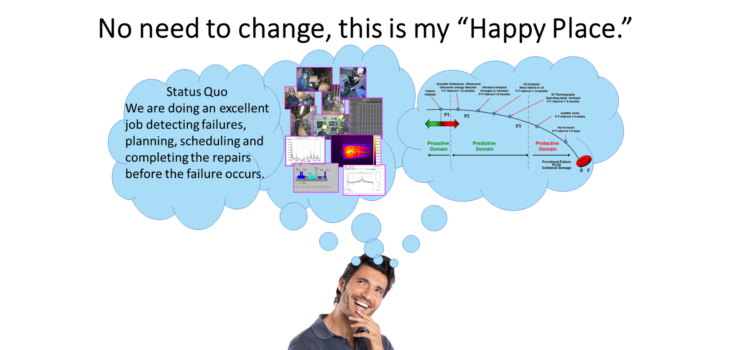
These programs are a major cultural change and paradigm shift for organizations moving from a status quo and reactive state to focusing on continuous improvement, eliminating losses, and following best in class processes, procedures and standards. This means we live by the philosophies of “Do what we say we are going to do,” “Fix it once, fix it right,” “Operate and care for machines in a precision manner” and “Strive for continuous improvement.”
By having a successful and supported reliability and precision program in place, an organization can expect a benefit of a 2 to 5 fold sustainable increase in the proactive timeline on the P-F curve. This increase is well depicted in the D-I-P-F Curve (shown below) originally developed by Doug Plucknett CRL, modified by Brian Heinsius CRL.
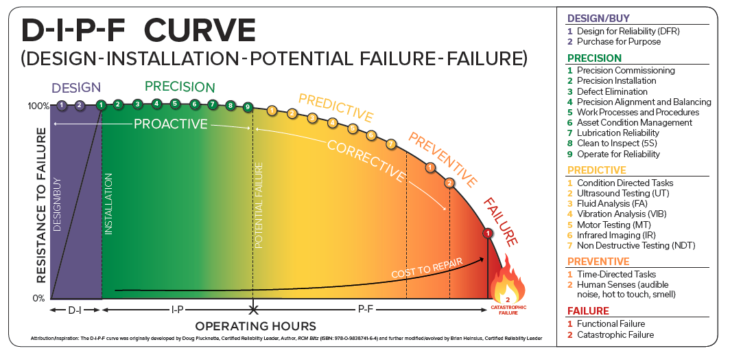
The indicated increase in the proactive domain is truly an increase in reliability and is not a myth or a theoretical increase. These are a few of the results experienced by organizations that have deployed and supported both reliability and precision programs.
- Redundant process equipment MTBF can be improved to 8-10 years and beyond
- Critical and essential equipment MTBF can be improved to 10-14 plus years
- Emergency call outs and overtime will be reduced
- Chronic and random incidents are being eliminated or the frequency is reduced
- Green maintenance is established through recycling, extended use lubricants, non-hazardous product usage and energy conservation
Reliability and precision programs are an essential part of the formula for an organization’s long-term sustainability, which ultimately means it provides value to the customers and stakeholders and ensures the long-term success of the organization.
The last of my three articles is to bring everything altogether focusing on the relationship of the failure curve, reliability, and safety. It is my spin on an article and presentation published by Dustin M Etchison, CMRP with Elanco Global Engineering. His approval helped set the direction for the final article.
Please note this article reflects the views, thoughts, and opinions of the author only. The author has been working in the fields of condition monitoring, precision maintenance, and reliability since 1983.


