Over the past few years we have heard a fair amount of political discussion surrounding power generation and fuel types. However, in 2019 renewable energy and sources surpassed coal energy for the first time since before 1885, which from 1776 to 1885 was primarily water, animal and wind power. The US Energy Information Administration (EIA) identified 11.5 quadrillion British Thermal Units (quads) generated by renewable sources while coal fell to its lowest use in 43 years at 11.3 quads. Even with shifts in operations in 2020, industrial and manufacturing use was 23% of total energy consumption, transportation uses 28%, residential is 7%, commercial facilities are at 5% and electrical power generation uses 37% of all energy. Power generation from non-renewable sources account for 1.87 billion metric tons of CO2 in the USA.
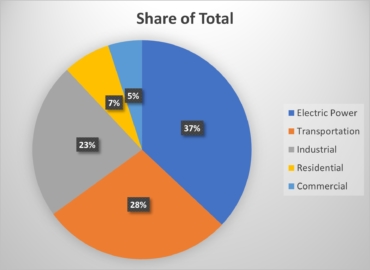
Figure 1: Sources of Energy Consumption all types
Electrical generation in 2019 broke down as shown in Figure 2, with solar and wind sources growing rapidly and wind taking a lead at 7% of total US electrical generation and 42% of renewable energy generation surpassing hydroelectric. What is important with this trend is that all aspects of our lives are effected by electrical power from home to work and communications to transportation. We learned the potential impact of electrical distribution reliability on August 14, 2003, with the Northeast Blackout and we are viewing the impacts now with rolling blackouts and severe electrical use curtailment in California towards the end of summer, 2020.
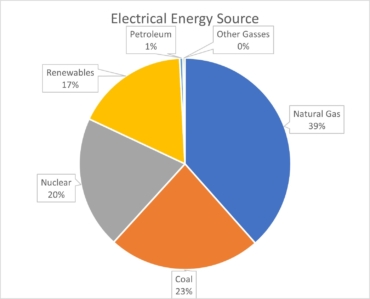
Figure 2: Electrical energy generation
The Northeast blackout, which was initiated due to a combination of maintenance and automated monitoring issues, resulted in the loss of 61,800 megawatts (MW) of electrical load across 4 days and 14 days to full restoration and an impact on 55 million people throughout Northeastern USA and Canada. In Canada, the impact was a reduction of 0.7% Gross Domestic Product (GDP) and a net loss of 18.9 million work hours. The USA saw an impact ranging between $4 billion and $10 billion. Water systems, communcations, transportation and essential human services were impacted during warm weather. The total number of deaths related to the outage with an estimate of 100 deaths attributed and, in New York alone, over 3,000 fires due to candles and emergency services responded to an additional 80,000 calls for help. At the time, a majority of power generation sources were large fossil fuel plants and some of the protections in place from the 1977 Northeast blackout had been disabled as part of electrical power de-regulation in the early 1990s.
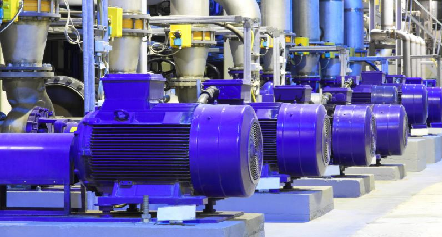
From a reliability standpoint, how does electrical power and distribution effect our commercial and industrial facilities? Industrial facilities use 27% of electrial energy generatoed, commercial applications use 35%, and residential is 37%. Over half of electrical energy used within industry is through electric motors with the rest being process and control with some lighting. Depending on the industry, electrical power is often the majority of power consumption in an industrial facility with other energy sources effected by electrical availability. Effectively, the loss of electrical power impacts not just the facility but also supporting industries and services.
There are a number of areas that impact the reliability of electrical energy from fuel to generation to distribution and once it is delivered to the facility. Each area is effected by proper maintenance and component reliability with the failure of any part of the electrical power system having an impact. The guidelines for power reliability have not significantly changed since the widespread use of Alternating Current (AC), with some power quality standards being developed and introduced due to an increased use of power electronics and smaller power supplies, then again as small generation through utility-scale renewable sources came online.
At the generation level, the reliability of power generation depends on the type of generation with larger stations carrying a higher risk due to a small number of large generators versus wind power where a utility scale site may have from ten 1.5+ Megawatt generators to several hundred. In the EIA February, 2020, report “Capital Cost and Performance Characteristic Estimates for Utility Scale Electric Power Generating Technologies,” the summary identifies that a small land-based wind facility costs $1677/kW to build and a fixed cost of $35.14/kW-year for operations and maintenance and no costs associated with fuel; a large wind facility would be $1265/kW to build and $26.34/kW-year operations and maintenance; as compared to a coal fired facility which carries a capital cost of $3,676/kW, a fixed operations and maintenance cost of $54.30/kW-year, variable operations and maintenance costs of $7.08/MWh, and associated fuel costs. These are the extremes with most other types of facilities, with the exception of nuclear, falling between.
The loss of a large-scale single facility generator can be signficant as demonstrated in 2000 when a small 500 MW nuclear power facility was out of operation for more than a day due to a small 50hp lubricating pump motor failure. With wind generation, the fuel is subject to weather with the average minimum windspeed being 2.8 m/s and the high end being 50 m/s. Following deregulation in the 1990s, large plants also eliminated ‘spinning reserves,’ which opened the way for peaking stations, which generally were gas fired generators which could be brought online rapidly. With the introduction of renewable energy sources, electrical storage methods from battery to pumping stations and flywheel technologies have been introduced since the 1990s with the focus of stabilizing the grid due to the lower predictibility as well as occassional lack of fuel source, such as sunlight at night.
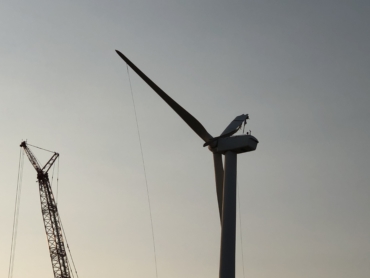
Figure 3: Generator with Broken Blade
Presently, wind generators and solar have a higher rate of failure than larger gas and coal plants. With the constant starting and stopping, energizing and de-energizing, as well as environmental conditions and component defects, wind generators have a generally higher failure rate. The main components that fail frequently include the blades; gearboxes; generators; and main bearings in that order. Smaller components including yaw motors and gearboxes, limit switches, seals, pitch motors and gearboxes, and other control components may also fail, but limited data is available as to the frequency. When we step back from a wind turbine and view a wind farm, which is a collection of wind turbines, as the generation source, the conditions that can impact availability then include transformers, both the tower transformers and internal distribution transformers, cables, controls, and other parts of the systems. In these cases, the transformers, due to variable loading with resulting heating and gassing, and cable splicing become concerns. Because the individual smaller generators are distributed even with the failure of a tower, the site still generates and are considered, including lost wind, to be above 97% availability and, also due to the distributed nature, more resilient in providing power.
In the next article we will explore the reliability of wind turbines in detail.